Introducing the Structured Output Benchmark (SOB)
copy markdown
LLMs are increasingly deployed to produce structured data from unstructured and semi-structured sources, parsing invoices, medical records, meeting transcripts, and converting PDFs to database rows.
For deterministic output, the next step in a workflow reads a specific key and expects a specific type. A hallucinated invoice_total or an array ordered incorrectly because of inaccurate date values silently breaks downstream systems. Yet existing benchmarks either check schema compliance alone or evaluate value correctness within a single source domain.
Top 5 at a glance
A side-by-side look at the top 5 models across all seven metrics. The structural metrics (JSON Pass, Path Recall, Structure Coverage, Type Safety) cluster near the ceiling for every model, while Value Accuracy and Perfect Response separate them.
The problem with current structured output benchmarks
Most benchmarks collapse "structured output quality" into a single number: does the response parse, and does it validate against the schema? That's necessary, not sufficient.
| Problem in current benchmarks | What it misses |
|---|---|
| Schema compliance as the only metric | A model can emit perfectly valid JSON with wrong values and score 100% |
| Single-source inputs (text only) | Real systems extract from OCR, screenshots, meeting audio, and PDFs, not just clean text |
| No difficulty weighting | Medium and hard schemas are scored identically, hiding which models actually handle nested structure |
| No separation of parse / structure / value errors | You can't tell if a model failed at JSON, at the schema, or at the facts |
| Reasoning / chain-of-thought blended in | Results measure reasoning + extraction together, not the extraction capability itself |
References to existing benchmarks: JSONSchemaBench | StructEval | DeepJSONEval | LLMStructBench | ExtractBench | STED
How SOB works
SOB evaluates structured output across three modalities using the same scoring harness. The goal is to isolate the extraction capability from every other ability a model has.
Three sources, one scoring pipeline
| Modality | Source dataset | Eval records |
|---|---|---|
| Text | HotpotQA context passages | 5,000 |
| Image | olmOCR-bench documents | 209 |
| Audio | AMI Meeting Corpus conversations | 115 |
Every record is paired with a JSON Schema and a ground-truth answer that was verified against the source context through human authoring with an LLM cross-check, so a missing or hallucinated value is unambiguously wrong.
To isolate the structured-output capability from vision and ASR quality, image and audio records are converted to text-normalized context before scoring. Models see the same modality-stripped context, and the differences that remain are attributable to how they handle schemas, nesting, and value grounding under different content distributions.
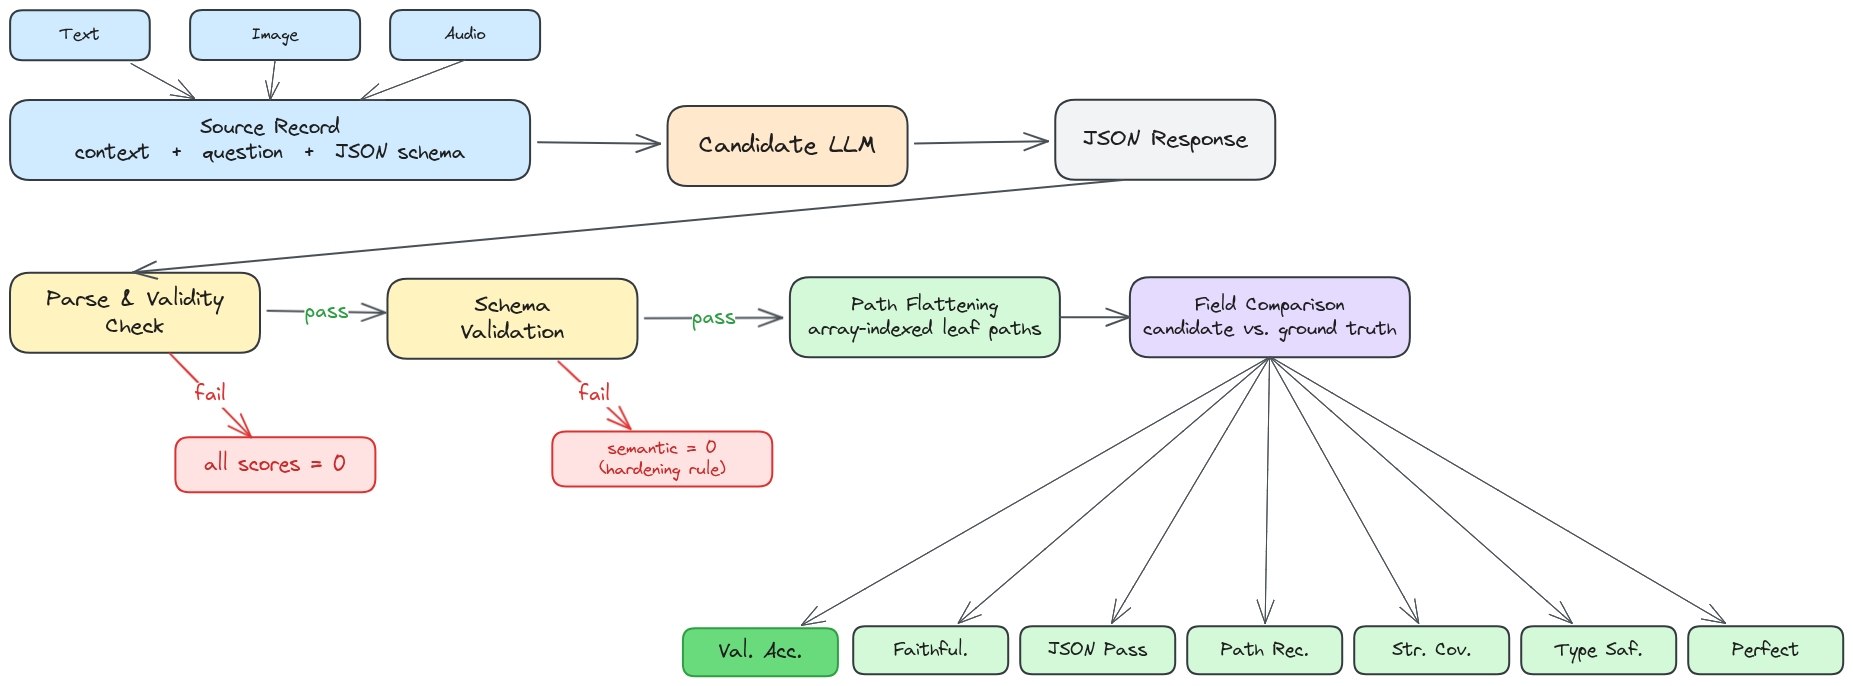
Seven metrics, not one
SOB reports seven metrics per record so you can see exactly where a model fails:
| Metric | What it measures |
|---|---|
| Value Accuracy | Exact leaf-value match against the verified ground truth (primary) |
| JSON Pass Rate | The response is parseable JSON |
| Type Safety | All leaf values match the declared JSON Schema types |
| Structure Coverage | The response includes the required object/array structure |
| Path Recall | All required JSON paths (keys) are present |
| Faithfulness | Values are grounded in the source context, not hallucinated |
| Perfect Response | Every leaf value is exactly correct for the full record |
Value Accuracy is the metric that matters for production. It's the share of fields a downstream system can trust without a human review step.
Scoring gates
Two gates prevent inflated scores from schema-only wins:
- Hardening gate: If JSON parse fails, downstream semantic metrics are zeroed for that record.
- Coverage gate: Value Accuracy is only credited on fields the model actually returned, with missing paths counting as wrong.
Each schema is tagged medium (nested objects or arrays of scalars, depth 2) or hard (arrays of objects, or depth ≥3). Hard schemas dominate the corpus (61% on text, 88% on image, 98% on audio), and the final leaderboard is schema-complexity-weighted (easy = 1.0, medium = 2.0, hard = 3.0) so hard schemas contribute more to the ranking than medium ones.
The results
We ran SOB on all models at temperature 0.0, max output 2048 tokens and no reasoning/thinking wherever the provider allows it, so the score reflects pure structured output and extraction capability.
A note on reasoning-locked models
A handful of models in the leaderboard cannot have reasoning fully turned off, so they ran in their lowest-reasoning configuration:
- GPT-5 and GPT-5-Mini: the API only allows a minimum reasoning effort, not a full disable. The lowest accepted value also changed between generations, from
"minimal"on GPT-5 / GPT-5-Mini to"none"on GPT-5.5. - Gemini-3.1-Pro and Gemini-3-Flash-Preview: thinking is built into the model and can be set to its lowest budget but not switched off.
- DS-R1-Distill-32B: chain-of-thought is intrinsic to the model, baked in during distillation.
- Claude-Opus-4.7: Anthropic deprecated the temperature parameter for this model, so it runs without one (the rest are at temperature 0.0).
- Phi-4: only evaluated on text and image. Excluded from audio because its 16K context window cannot fit the longer AMI transcripts, so audio counts use 27 models.
That means the locked models above are scored with a small reasoning advantage the others do not get, yet several non-reasoning models still beat them on Value Accuracy.
Unified leaderboard
| Rank | Model | Overall | Value Acc | Faithfulness | JSON Pass | Path Recall | Structure Cov | Type Safety | Perfect |
|---|---|---|---|---|---|---|---|---|---|
| 1 | GPT-5.4 | 0.870 | 0.798 | 0.869 | 0.993 | 0.988 | 0.981 | 0.993 | 0.469 |
| 2 | Gemini-3.1-Pro | 0.869 | 0.820 | 0.876 | 0.966 | 0.960 | 0.958 | 0.966 | 0.542 |
| 3 | GLM-5.1 | 0.866 | 0.806 | 0.872 | 0.975 | 0.969 | 0.967 | 0.975 | 0.498 |
| 4 | Claude-Opus-4.7 | 0.864 | 0.787 | 0.877 | 0.993 | 0.988 | 0.983 | 0.993 | 0.424 |
| 5 | GLM-4.7 | 0.861 | 0.804 | 0.868 | 0.965 | 0.959 | 0.957 | 0.965 | 0.508 |
| 6 | Qwen3.5-35B | 0.861 | 0.801 | 0.863 | 0.969 | 0.962 | 0.960 | 0.969 | 0.500 |
| 7 | GPT-5.5 | 0.860 | 0.795 | 0.868 | 0.978 | 0.971 | 0.968 | 0.978 | 0.464 |
| 8 | Gemini-2.5-Flash | 0.860 | 0.796 | 0.856 | 0.972 | 0.967 | 0.961 | 0.972 | 0.498 |
| 9 | Qwen3-235B | 0.857 | 0.786 | 0.854 | 0.978 | 0.970 | 0.968 | 0.978 | 0.463 |
| 10 | Interfaze-Beta | 0.855 | 0.795 | 0.858 | 0.967 | 0.962 | 0.957 | 0.967 | 0.480 |
| 11 | Claude-Sonnet-4.6 | 0.854 | 0.779 | 0.858 | 0.979 | 0.975 | 0.969 | 0.979 | 0.442 |
| 12 | Claude-Opus-4.6 | 0.853 | 0.779 | 0.860 | 0.977 | 0.973 | 0.968 | 0.977 | 0.437 |
| 13 | DeepSeek-V4-Pro | 0.853 | 0.796 | 0.858 | 0.960 | 0.952 | 0.953 | 0.960 | 0.490 |
| 14 | Kimi-2.6 | 0.853 | 0.791 | 0.856 | 0.964 | 0.958 | 0.954 | 0.964 | 0.482 |
| 15 | GPT-4.1 | 0.850 | 0.783 | 0.853 | 0.969 | 0.963 | 0.959 | 0.969 | 0.454 |
| 16 | GPT-5 | 0.849 | 0.769 | 0.859 | 0.983 | 0.978 | 0.972 | 0.983 | 0.398 |
| 17 | Gemma-3-27B | 0.847 | 0.777 | 0.842 | 0.969 | 0.961 | 0.958 | 0.969 | 0.454 |
| 18 | Qwen3-30B | 0.842 | 0.753 | 0.832 | 0.983 | 0.974 | 0.970 | 0.983 | 0.401 |
| 19 | Nemotron-3-Nano-30B | 0.841 | 0.747 | 0.817 | 0.987 | 0.975 | 0.971 | 0.987 | 0.400 |
| 20 | GPT-5-Mini | 0.835 | 0.751 | 0.837 | 0.972 | 0.966 | 0.960 | 0.972 | 0.388 |
| 21 | Gemma-4-31B | 0.833 | 0.778 | 0.843 | 0.943 | 0.934 | 0.934 | 0.943 | 0.461 |
| 22 | Gemini-3-Flash-Preview | 0.833 | 0.773 | 0.831 | 0.939 | 0.935 | 0.929 | 0.939 | 0.484 |
| 23 | Schematron-8B | 0.832 | 0.731 | 0.807 | 0.987 | 0.976 | 0.969 | 0.987 | 0.370 |
| 24 | IBM-Granite-4.0 | 0.832 | 0.736 | 0.812 | 0.983 | 0.965 | 0.967 | 0.983 | 0.381 |
| 25 | Phi-4 | 0.831 | 0.787 | 0.849 | 0.969 | 0.961 | 0.961 | 0.969 | 0.452 |
| 26 | DS-R1-Distill-32B | 0.827 | 0.747 | 0.819 | 0.960 | 0.945 | 0.947 | 0.960 | 0.411 |
| 27 | Ministral-3-14B | 0.778 | 0.700 | 0.773 | 0.906 | 0.898 | 0.896 | 0.906 | 0.368 |
| 28 | GPT-OSS-20B | 0.732 | 0.667 | 0.730 | 0.845 | 0.838 | 0.836 | 0.845 | 0.362 |
The top six are within 1 point of each other on overall score, but swap freely across individual metrics. Rank order is metric-specific, not absolute. Gemini-3.1-Pro tops the unified Value Accuracy leaderboard at 82.0%, edging out GLM-5.1 (80.6%), GLM-4.7 (80.4%), and Qwen3.5-35B (80.1%), three open-weight models that beat several frontier closed-source releases on the metric that matters most for production extraction.
Cost: the top two rarely win in production
The two leaders are also the two most expensive models on this list. GPT-5.4 runs 15.00 per 1M input/output tokens, Gemini-3.1-Pro 12.00. Compare that to the models trailing them by under 2 points on Value Accuracy:
| Model | Value Accuracy | Input | Output | Output cost vs GPT-5.4 |
|---|---|---|---|---|
| GPT-5.4 | 79.8% | $2.50 | $15.00 | 1.00x |
| Gemini-3.1-Pro | 82.0% | $2.00 | $12.00 | 0.80x |
| GLM-5.1 | 80.6% | $1.05 | $3.50 | 0.23x |
| GLM-4.7 | 80.4% | $0.60 | $2.20 | 0.15x |
| Qwen3.5-35B | 80.1% | $0.163 | $1.30 | 0.09x |
| Gemini-2.5-Flash | 79.6% | $0.30 | $2.50 | 0.17x |
Prices are per 1M tokens on each provider's standard public API tier. A pipeline running Qwen3.5-35B, GLM-4.7, or Gemini-2.5-Flash costs anywhere from 6x to 11x less per correct field than the benchmark leader, while losing at most ~2 percentage points of Value Accuracy. That is why the top two models, despite leading SOB, are rarely the default choice for production structured-output pipelines.
Per-metric charts
Each chart re-sorts all 28 models on that single metric, so you can see which models win each category (not just the overall average).
To expose the gaps, each chart's x-axis starts from a floor appropriate to that metric (e.g. 60% for Value Accuracy, 80% for JSON Pass). Without that, the top cluster looks identical.
Value Accuracy
The metric production systems care about. Gemini-3.1-Pro leads at 82.0%, with three open-weight models (GLM-5.1, GLM-4.7, Qwen3.5-35B) trailing it inside a 2-point band.
Faithfulness
How often values are grounded in context instead of hallucinated.
JSON Pass Rate
Almost every modern model clears 95%+ in the unified leaderboard. This is why a pass-rate-only benchmark can't separate them anymore.
Path Recall
Whether all required keys appear in the output.
Structure Coverage
Whether nested objects and arrays are present with the correct shape.
Type Safety
Whether leaf values respect the declared JSON Schema types (no strings where numbers are expected).
Perfect Response Rate
The fraction of records where every single leaf value is exactly right. This is the hardest metric and collapses to roughly half even for the best models.
The JSON-pass vs Value-Accuracy gap
The single most important view: most models clear 95%+ on JSON Pass, but Value Accuracy sits 15 to 30 points lower. That gap is the space where structured output benchmarks have been lying to us.
The gap column is the headline. Every model on this list passes JSON parsing 97%+ of the time, but actual leaf-value extraction drops by 17 to 26 points. GLM-5.1 has the tightest gap (16.9 pp) and the highest Value Accuracy on the list, while Schematron-8B passes JSON 98.7% of the time but lands the lowest Value Accuracy at 73.1%, a 25.6 point fall.
| Model | JSON Pass | Value Accuracy | Gap |
|---|---|---|---|
| GPT-5.4 | 99.3% | 79.8% | 19.5 pp |
| Claude-Opus-4.7 | 99.3% | 78.7% | 20.6 pp |
| Nemotron-3-Nano-30B | 98.7% | 74.7% | 24.0 pp |
| Schematron-8B | 98.7% | 73.1% | 25.6 pp |
| GPT-5 | 98.3% | 76.9% | 21.4 pp |
| Qwen3-30B | 98.3% | 75.3% | 23.0 pp |
| IBM-Granite-4.0 | 98.3% | 73.6% | 24.7 pp |
| Claude-Sonnet-4.6 | 97.9% | 77.9% | 20.0 pp |
| GPT-5.5 | 97.8% | 79.5% | 18.3 pp |
| Qwen3-235B | 97.8% | 78.6% | 19.2 pp |
| Claude-Opus-4.6 | 97.7% | 77.9% | 19.8 pp |
| GLM-5.1 | 97.5% | 80.6% | 16.9 pp |
Modalities diverge more than we expected
The same model scores very differently across text, image, and audio, even when every model gets the same text-normalized context. Audio is the hardest by far. The transcripts are long (~7,300 tokens on average) and full of overlapping speakers, so models struggle to pull out the right values.
Best Value Accuracy by modality across all valid models:
| Modality | Best Value Accuracy | Leader |
|---|---|---|
| Text | 84.5% | Gemini-3.1-Pro |
| Image | 67.2% | Gemma-4-31B |
| Audio | 23.7% | Gemini-2.5-Flash |
No single model wins all three. GPT-5.4 ranks 5th on text but 13th on images. Schematron-8B ranks 26th on text but 15th on images. Gemma-4-31B ranks 18th on text but 1st on images.
Patterns worth internalizing
- Valid JSON ≠ correct JSON. JSON Pass and Value Accuracy diverge by 15 to 30 points on every frontier model.
- Structural metrics mask value errors. Path Recall / Structure Coverage / Type Safety can all read ~99% while 20 to 30% of leaf values are still wrong, and Perfect Response collapses to about half even for the top models.
- Model size is not a predictor. GLM-5.1, GLM-4.7, and Qwen3.5-35B (open-weight) beat GPT-5, Claude-Opus-4.7, and Claude-Sonnet-4.6 on unified Value Accuracy. Phi-4 (14B) edges out GPT-5 and GPT-5-Mini on text.
- Generation-over-generation gains are flat. GPT-5.5 trails GPT-5.4 by 0.3 pp on unified Value Accuracy, GPT-5.4 only edges GPT-4.1 by ~2 pp, and Claude-Opus-4.7 beats Opus-4.6 by less than 1 pp. Scaling compute alone hasn't closed the value-accuracy gap.
- Structured hallucinations are the hardest bug. The value is type-correct, schema-valid, and plausible, so it slips through most guardrails. On one audio record the ground truth is
"target_market_age": "15 to 35 years"and a model returns"25 to 35"— invisible without field-level checks. - Modalities don't transfer. Text-trained structured output behavior degrades sharply when the source is a transcribed conversation. Best Value Accuracy drops from 84.5% on text to 67.2% on images to 23.7% on audio.
- Rankings shift across modalities. Gemini-3.1-Pro leads text, Gemma-4-31B leads images, Gemini-2.5-Flash leads audio. No single model dominates all three, so a text-only leaderboard would mask the gaps.
What's next
SOB is a first step, not a finish line. We'll keep growing the benchmark along several axes:
- More datasets, including newer datasets with increasing complexity and difficulty.
- More schemas and difficulty tiers, including recursive types, unions, and large enum spaces.
- Continuous re-evaluation as new models ship, and ongoing transparent tracking of our own models against the same scoring harness so we can measure ourselves honestly.
Why we released SOB?
Our goal is to be the best general model for deterministic tasks and a key aspect of determinism is controllable and consistent output structure. The first step to making structured output better is to measure it and hold ourselves against the best.
- Docs: Structured Output in Interfaze
- Playground: Try structured output on Interfaze
- Paper: arXiv
- Dataset: Hugging Face